A single speed test is fun — hundreds of them may actually be accurate
Releasing the first internal build of the apps that included NordLynx was an exciting moment for the team. Everyone started posting their speed test results on Slack and discussing the variance, possibly caused by internet cable congestion, device limitations, and many other reasons.

While most of the time NordLynx outperformed other protocols, there were some cases with slightly worse speed results. We covered quite a few reasons for this in the previous post, where we also explained the methodology of the extensive testing we did to measure NordLynx performance. Yet, one question is still left unanswered: how many tests should you take to be certain that one protocol is faster than another?
Let’s take a deep dive into the confidence of our speed testing results and see if we can tick all the boxes on accurate measurement.
Time
We can start with the timing of the tests. To make a valid comparison, we need to make sure to equalize environmental conditions. Why? Let’s say you run a test for one protocol at 9 pm when the internet usage at your selected time zone is peaking, and run a test for another protocol at 4 am when the internet usage is at its lowest. Comparing the results of these tests would be the same as comparing the auto-brightness of your laptop screen during the day and during the night. You can do it, but it doesn’t tell you anything useful.
To avoid falling into such a statistical nightmare, observations of each test combination should be distributed across 24 hours as evenly as possible. As test combinations were randomly selected every two minutes, 24 hours a day, intuition says that their distribution should be even. But is it?
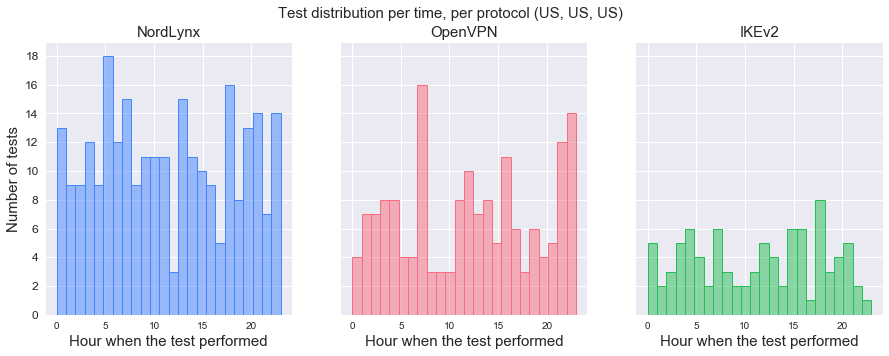
At first glance, it’s quite difficult to draw any conclusions, except that each protocol was tested at least once every hour. So let’s put statistics to work.
We can apply the Kolmogorov–Smirnov test between distributions and calculate a p-value. This may need some elaboration. The two-sided Kolmogorov–Smirnov test calculates a probability that two samples are from the same underlying distribution. Imagine you want to compare the hourly visitor count in New York City’s Central Park with the shelter-in-place order in effect and before it. You would use this test to know the probability of a significant behavioral change. As with most statistical tests, a p-value is calculated to express that probability, allowing to accept or reject a hypothesis.
Let’s take the case where a virtual machine, a VPN server, and a Speedtest server were in the US (Fig.1). After applying the Kolmogorov–Smirnov test, we can conclude that there are no significant differences between:
- Timing of NordLynx tests and OpenVPN tests (p-value: 0.43);
- Timing of NordLynx tests and IKEv2 tests (p-value: 0.99);
- Timing of IKEv2 tests and OpenVPN tests (p-value: 0.30).
This applies to 811 of our tested combinations that included NordLynx. The other 69 were rejected because of too high a probability of significant distribution differences.
Back to the question of how many tests it takes to be certain about results. It is safe to say that doing even hundreds of tests sometimes doesn’t guarantee comparable results. At least these 69 rejected combinations suggest that. As you can see in the example below (Fig. 2), it would have been difficult to compare results with such considerable differences.

Confidence
The best way to see an eye-rolling statistician is to forget to measure the significance of your test results. The intuition behind this eye roll is that speed test results vary because of environmental conditions, but odd results are much less likely than representative ones. For example, we know that rolling each number on a dice has an equal probability, but try rolling the dice six times and getting each number only once. However, rolling the same dice for a few thousand times would even up the number of times you get each side with an error so low that it doesn’t make much difference to the result.
Having multiple speed tests done allows us to calculate a possible error out of the variance of distribution. That also allows defining confidence intervals – a range of values that we hope includes the true speed test value. If the confidence intervals don’t overlap, we can say that we are certain about the speed difference between protocols.
Figure 3. Confidence of results per number of tests.
The example above (Fig. 3) illustrates the case when a test is performed with a virtual machine, a VPN server, and a Speedtest server in the US. The graphic shows how confidence changes with the number of speed tests done. There are a couple of things worth noting here.
First, for this particular combination, it looks like we needed at least 45 tests to draw conclusions. Also, if we zoom into the first few tests, we can see that OpenVPN started off better than IKEv2, but quickly lost its position. The mean-crossing point between OpenVPN and IKEv2 is a great visualization of why you shouldn’t trust the results of a single speed test when comparing protocols.
And we’re not just done yet. Of course, inspecting 811 combinations to determine if their confidence intervals don’t overlap would be time-consuming. Also, comparing the means of distributions that aren’t normal would be a mistake. That’s why we need to use statistical tests again. This time, we are interested in comparing the median values of the distributions. As we assume that the speed test results aren’t distributed normally, we apply the Mann–Whitney U test. Now it looks like we’re ready to look at the results.
The results
NordLynx has significantly greater median speed values in 377 combinations, IKEv2 – in 69, OpenVPN – in 2.
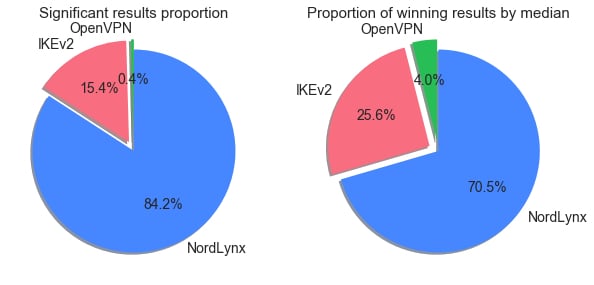
After applying Mann–Whitney U test to the results of all available combinations, we see that in the majority of conclusive results, NordLynx performs better than the other two protocols. If we look at the comparison of winning results by median values only, we would see slightly different proportions. It means that inconclusive tests are a bit more likely to show higher median speed values for IKEv2 and OpenVPN than for NordLynx.
NordLynx outperformed other protocols in all combinations where the tests were conclusive and a virtual machine, a VPN server and a Speedtest server were in the same country.
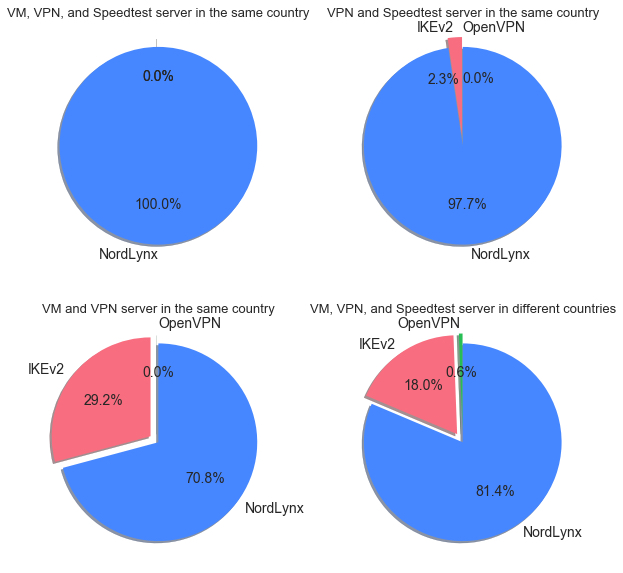
An important point to make here is that the longer the route between a virtual machine and a Speedtest server, the more noise there is in the actual speed test results when comparing protocols. So it’s interesting to see that NordLynx performed better in all conclusive same-country combinations. Also, in 97% of tested combinations, where a VPN server and a Speedtest server were in the same country, NordLynx showed significantly better results. Note that IKEv2 showed better results in some very long distance combinations, for example, France – France – Japan or Netherlands – Netherlands – Australia.
So what’s the answer?
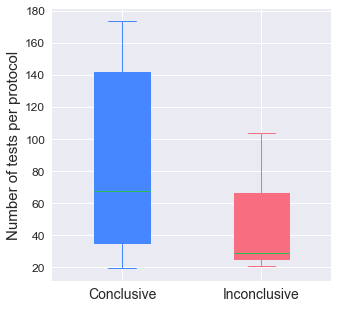
Finally, we can tell how many tests you should take to be certain that one protocol is faster than another. From what we see, performing between 38 and 141 tests per protocol is required to get significant results. But remember to spread out your tests evenly across 24 hours.
If you aren’t yet covered by a VPN, download VPN app for free and purchase a subscription that works best for you. Once you launch the app, you’ll be protected by some of the best and fastest encryption in the industry.